Low-code data visualization and aggregation with OpenSearch Dashboards
- Track: HPC, Big Data, and Data Science devroom
- Room: D.hpc
- Day: Saturday
- Start: 10:00
- End: 10:30
- Video with Q&A: D.hpc
- Video only: D.hpc
- Chat: Join the conversation!
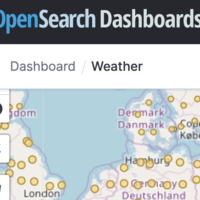
Working with Big Data means that we need tools to organise and understand the data. And you don’t have to be a developer to search, aggregate and visualise your data. Whether you need an affordable business analytics tool or you want to analyse log data in near real time, OpenSearch can help you. And all of it through a visual interface of OpenSearch Dashboards.
After listening to this talk you’ll understand the basics of working with an OpenSearch cluster and different use cases it supports. You’ll also learn to create your first search and aggregation query and visualise the outcomes with the help of OpenSearch Dashboards.
This talk is for those who have little or no previous experience of OpenSearch (and Elasticsearch) and who are looking for solutions for searching, monitoring or data analysis with no coding required.
In this session the audience will get theoretical and a knowledge on what OpenSearch is, which use cases it supports and how the audience can start using it for their data already today. Roles outside of developers are welcome, the information will be presented in uncomplicated terms and we’ll use visualisation tools to create and run requests, so no coding is required.
Speakers
| Olena Kutsenko |